This is a quick and simple demonstration of how I used Power BI’s Query Editor to clean, normalize, and model a Human Resources data set.
The Data Set:
I first learned about data modeling from using Excel’s Power Query. When I moved on to learning Power BI, I came across a data set that I thought could be a great tool for practicing data modeling. The data set was designed by Dr. Rich Heubner and Dr. Carla Patalano of New England College of Business for the purpose of teaching HR graduate students HR metrics, measurement, and analytics. It was designed to accompany a case study with workforce diversity as the focal point.
The following is a description of each of the columns in the data set:
| Feature | Description | DataType |
|---|---|---|
| Employee Name | Employee’s full name | Text |
| EmpID | Employee ID is unique to each employee | Text |
| MarriedID | Is the person married (1 or 0 for yes or no) | Binary |
| MaritalStatusID | Marital status code that matches the text field MaritalDesc | Integer |
| EmpStatusID | Employment status code that matches text field EmploymentStatus | Integer |
| DeptID | Department ID code that matches the department the employee works in | Integer |
| PerfScoreID | Performance Score code that matches the employee’s most recent performance score | Integer |
| FromDiversityJobFairID | Was the employee sourced from the Diversity job fair? 1 or 0 for yes or no | Binary |
| PayRate | The person’s hourly pay rate. All salaries are converted to hourly pay rate | Float |
| Termd | Has this employee been terminated – 1 or 0 | Binary |
| PositionID | An integer indicating the person’s position | Integer |
| Position | The text name/title of the position the person has | Text |
| State | The state that the person lives in | Text |
| Zip | The zip code for the employee | Text |
| DOB | Date of Birth for the employee | Date |
| Sex | Sex – M or F | Text |
| MaritalDesc | The marital status of the person (divorced, single, widowed, separated, etc) | Text |
| CitizenDesc | Label for whether the person is a Citizen or Eligible NonCitizen | Text |
| HispanicLatino | Yes or No field for whether the employee is Hispanic/Latino | Text |
| RaceDesc | Description/text of the race the person identifies with | Text |
| DateofHire | Date the person was hired | Date |
| DateofTermination | Date the person was terminated, only populated if, in fact, Termd = 1 | Date |
| TermReason | A text reason / description for why the person was terminated | Text |
| EmploymentStatus | A description/category of the person’s employment status. Anyone currently working full time = Active | Text |
| Department | Name of the department that the person works in | Text |
| ManagerName | The name of the person’s immediate manager | Text |
| ManagerID | A unique identifier for each manager. | Integer |
| RecruitmentSource | The name of the recruitment source where the employee was recruited from | Text |
| PerformanceScore | Performance Score text/category (Fully Meets, Partially Meets, PIP, Exceeds) | Text |
| EngagementSurvey | Results from the last engagement survey, managed by our external partner | Float |
| EmpSatisfaction | A basic satisfaction score between 1 and 5, as reported on a recent employee satisfaction survey | Integer |
| SpecialProjectsCount | The number of special projects that the employee worked on during the last 6 months | Integer |
| LastPerformanceReviewDate | The most recent date of the person’s last performance review. | Date |
| DaysLateLast30 | The number of times that the employee was late to work during the last 30 days | Integer |
Demonstrating any actual analytics work on this data set requires a whole separate post. For now, the goal is simply to demonstrate my data modeling skill set. If you take a look at the data, you will see why it lends itself so well for data modeling.
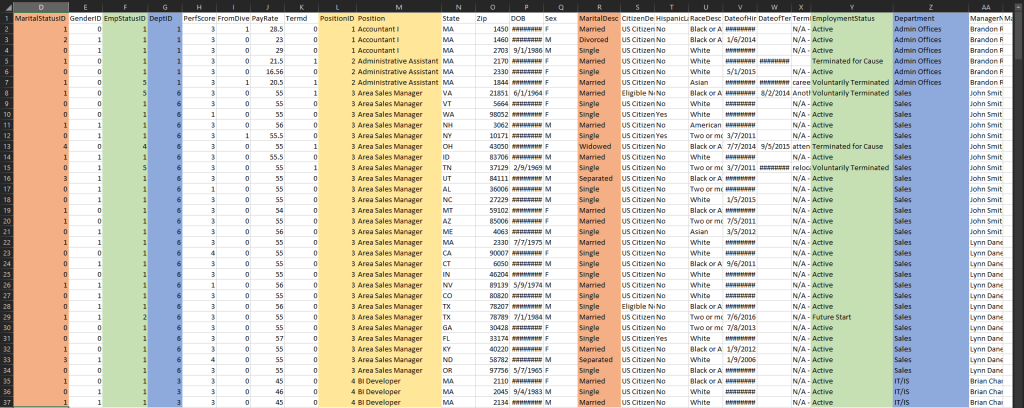
There are plenty of redundant columns. As an example, we can see that MaritalStatusID gives the information as the MaritalDesc (whether the person is married, divorced, single, etc.). The same is true with EmpStatusID and EmploymentStatus. We could easily split these ID-Descriptor pairs into separate tables to reduce redundancy, i.e., we could normalize this data set.
Note that normalization isn’t really necessary to do analysis on this data set. As I said before, I did this only as a demonstration of data modeling in Power BI. Another side-note is that I didn’t technically fully normalize the data. There are still some transitive dependence. I only did a very basic data normalization.
The Process:
I prepared a video showing how I processed the data from start to finish (loading, cleaning, normalizing, and modeling).
The following is a breakdown of each process and corresponding timestamps.
Data Cleaning
0:00 – 0:12 | I loaded the data set and did a quick glance to see how many NULL values we have. I removed most of the NULL values by removing all the NULL values in the Employee_Name columns.
0:13 – 0:30 | I split the Employee_Name column into two: a First_Name column and a Last_Name column. I used the comma as the separator and used the Trim functionality to remove the leading spaces in the First_Name values. I then noticed that the name “Jeremy Prater” was not split correctly because it didn’t have a comma in the first place. I corrected this manually. (I realized as I’m typing this that I left “Jeremy” in the Last_Name column and “Prater” in the First_Name column. “Jeremy” is most likely the person’s first name.)
0:35 – 0:45 | I replaced the single blank entry in the TermReason column with “Unknown”.
0:46 – 1:00 | I noticed that manager “Webster Butler” has a ManagerID of “39” and “null”. It’s possible that there are two managers named “Webster Butler” and that one was not assigned a ManagerID yet. I just assumed that these are the same person and so I replaced all “null” values with “39”.
1:05 – 1:27 | I corrected the Zip codes by adding back the leading zeros that was lost when the data set was loaded into Power BI. I did this by adding a custom column generated by the following M code: = Text.PadStart([Zip], 5, "0"). I then removed the original Zip column.
1:31 – 1:37 | I noticed that the HispanicLatino column has four unique values: “No”, “no”, “Yes”, and “yes”. I formatted this column by using the Capitalize Each Word method to remove the redundant “yes” and “no” values.
1:45 – 1:53 | I removed all the binary columns (MarriedID, GenderID, FromDiversityJobFairID, and Termd) because I believed they’re redundant. For example… all person with a MarriedID of “0” (i.e., never married) has a MaritalDesc of “Single”. If I would like to visualize the count of “Single” employees in the organization, I could just use the MaritalDesc column.
Data Normalization
2:10 – 2:24 | I created the Marital_Status table. I first copied both the MaritalStatusID and MaritalDesc columns into a new table. I then removed all the duplicate rows from this new table and sorted it by ascending MaritalStatusID.
2:40 – 2:55 | I created the Employment_Status table using the same method I used to create the previous table.
2:56 – 3:16 | I created the Departments table using the same method as before.
3:20 – 3:34 | I created the Performance_Scores table using the same method as before.
3:35 – 3:47 | I created the Performance_Scores table.
3:49 – 4:17 | I created the Citizenship_Status table. This time the CitizenDesc column does not come paired with an ID column. I had to generate the IDs. First, I copied the CitizenDesc column to a new table and removed all the duplicate values. I then added an index column and renamed it CitizenDescID. Finally, I merged this new table with the original table using the CitizenDesc columns as the connector and removed the CitizenDesc column from the original table.
4:18 – 4:43 | I created the Race_Descriptions table by using a similar method.
4:44 – 5:10 | I created the Termination_Reasons table using the same method.
5:11 – 5:25 | I created the Managers table. This time, the ManagerName column does come paired with a ManagerID column. There was no need to create a new ID column.
5:26 – 5:55 | I created the Recruitment_Sources table. The RecruitmentSource column does NOT come paired with an ID column. I generated an ID column called RecruitmentSourceID.
5:56 – 7:14 | I did a final check on the data set. I changed the data types of all ID fields into Whole Number and rearranged the columns to what I think makes more sense.
Data Modeling
7:23 – 8:22 | I designed the data model. I created relationships between the main Fact table and each of the Dimension tables. I connected each foreign key in the Fact table with a corresponding primary key in each of the Dimension table. The resulting schema is a Star schema.
And that’s it! Yes, it isn’t practical to do all this work for this particular data set. However, I believe it’s great practice for a situation when the data at hand is split into separate systems or csv files. I believe that knowing how to connect several data sources is a crucial data analysis skill. I hope that after reading through this post, you’re convinced that I have it.